



Most nonprofit leaders don't manage a fundraising portfolio. They manage a pile of programs that accumulated over the years. Someone started a gala in 2014, a major gifts officer got hired in 2019, the direct mail program has been running since before anyone currently on staff arrived, and digital got bolted on during the pandemic. Nobody sat down and decided these channels deserved the budget they currently consume. They just kept getting renewed because killing a line item feels riskier than funding it.
That's the actual problem a strategic fundraising portfolio framework solves. It's not about producing a prettier board deck. It's about forcing a disciplined answer to a question most organizations avoid: given finite money and staff capacity, where should the next dollar go, and how will we know when to pull it back out?
This article lays out the components you actually need — a scoring matrix the board can read in five minutes, sample multi-year allocation scenarios, an ROI-against-risk workbook, decision gates that trigger rebalancing, and reusable templates your successor can inherit without a two-hour handoff meeting. The goal is a system that survives staff turnover and board transitions, not a one-off exercise that dies in a shared drive.
Why portfolio thinking breaks down in practice
The gap between how boards think they allocate and how money actually moves is wide. On paper, everyone agrees that diversified revenue is good and that over-reliance on any single source is dangerous. In the budget meeting, something different happens. A few patterns come up repeatedly:
-
Last year's budget becomes this year's baseline. The default is "same as last year, plus or minus inflation." Nobody re-justifies the gala from zero. It just carries forward, even if its net margin has been shrinking for three years.
-
Loud channels crowd out efficient ones. The event with the big committee and the board champion gets protected. The quiet monthly giving program that actually has the best retention economics gets ignored because no one is advocating for it in the room.
-
Risk is discussed emotionally, not structurally. "We can't lose the gala, it's who we are" is an identity argument, not a risk assessment. Meanwhile the fact that 40% of unrestricted revenue comes from eleven donors over age 75 doesn't make it onto any dashboard.
What breaks at scale is coordination. A $600k organization can run on the executive director's gut. At $4M, with a development team of six and three board committees weighing in, gut decisions produce chaos — overlapping asks, channels competing for the same donors, and a finance team that can't forecast because allocation keeps shifting mid-year based on whoever lobbied hardest.
A portfolio framework replaces lobbying with a repeatable scoring process. It doesn't remove judgment. It makes the judgment visible and comparable across very different programs.
The scoring matrix: making unlike things comparable
The core challenge is that a planned-giving program and a Facebook fundraising campaign can't be compared on the same raw numbers. One pays off in fifteen years; the other pays off in fifteen days. A scoring matrix normalizes them onto shared dimensions so a board member can look at both and make a reasonable call.
Simplify donor management and fundraising workflows.
Givioly helps you organize campaigns, engage donors, and maximize fundraising impact seamlessly.
- Unified donor profiles
- Real-time donation tracking
- Automated impact reporting
No credit card required
Here's a workable structure. Each channel or program gets scored 1–5 on each dimension, and dimensions get weighted based on your organization's current priorities.
| Dimension | What it measures | Weight (example) |
|---|---|---|
| Net yield | Revenue minus fully-loaded cost, including staff time | 25% |
| Revenue reliability | How predictable the income is year over year | 20% |
| Donor acquisition value | Does this channel bring in new donors or just process existing ones? | 15% |
| Upgrade potential | Can donors here move to higher levels over time? | 15% |
| Mission alignment | Fit with brand, values, and stakeholder relationships | 10% |
| Capacity strain | Staff and volunteer load relative to output (inverse score) | 15% |
The weighting is the important part, and it's where boards earn their keep. An organization sitting on a healthy reserve and chasing growth should weight donor acquisition heavily. An organization that nearly missed payroll last spring should weight revenue reliability and net yield far above growth potential. The same channel can score completely differently at two organizations, and that's correct.
One mistake worth flagging: don't let "mission alignment" become a score-rescue mechanism. Organizations inflate the alignment score on a beloved-but-unprofitable event specifically to keep its total respectable — it's more common than most boards want to admit. If the gala is a community-building and board-engagement investment rather than a revenue program, say that explicitly and move it to a different part of the budget. Don't launder a weak revenue score through a soft dimension.
For boards building out the underlying measurement, it helps to have agreed definitions before you start scoring. The Board Fundraising KPI Framework for Executives covers the metric definitions that feed cleanly into a scoring exercise like this — without shared definitions, two committee members will score "net yield" using completely different cost assumptions.
The ROI-against-risk workbook
Scoring tells you how programs rank. It doesn't tell you where they sit on the two axes that actually drive portfolio decisions: return and volatility. A workbook that plots every channel on an ROI-by-risk grid gives leadership a picture no spreadsheet of totals can. Think of a simple four-quadrant map:
-
High return, low risk — Your foundation. Protect and modestly expand. Usually recurring/monthly giving and mature mid-level programs.
-
High return, high risk — Events, large one-time corporate gifts, a single mega-grant. Keep, but cap your dependence and build contingency.
-
Low return, low risk — Steady but small. Fine to maintain if staff strain is low; a candidate to cut if capacity is tight.
-
Low return, high risk — The quadrant where money quietly dies. New channels that haven't matured belong here temporarily; programs that have lived here for three years should be on the chopping block.
The workbook's real value is the risk column, because return is the number everyone already tracks and risk is the number nobody does. For each program, score concentration risk (how few donors drive most of the money), external dependency (how exposed you are to one foundation's board, one company's marketing budget, one platform's algorithm), and operational fragility (does it collapse if one key person leaves?).
A realistic example of how this changes a decision: a mid-sized arts nonprofit had a corporate sponsorship line generating around $280k a year — comfortably their highest "ROI" channel on paper, since the direct cost was low. The risk column told a different story. Three sponsors accounted for roughly 70% of that total, and all three renewals landed in the same Q4 window. On an ROI-only view, you'd pour more into corporate. On the ROI-by-risk view, the obvious move was to diversify the renewal calendar and build a second tier of mid-size sponsors before expanding — because one bad quarter could erase a fifth of the entire fundraising budget.
Getting the cost side of ROI right is harder than it looks, because most organizations undercount staff time and shared overhead. If your net-yield numbers are built on fuzzy cost allocation, the whole workbook tilts. When Overhead Numbers Mislead Leadership walks through activity-based costing that produces the fully-loaded figures this workbook depends on.
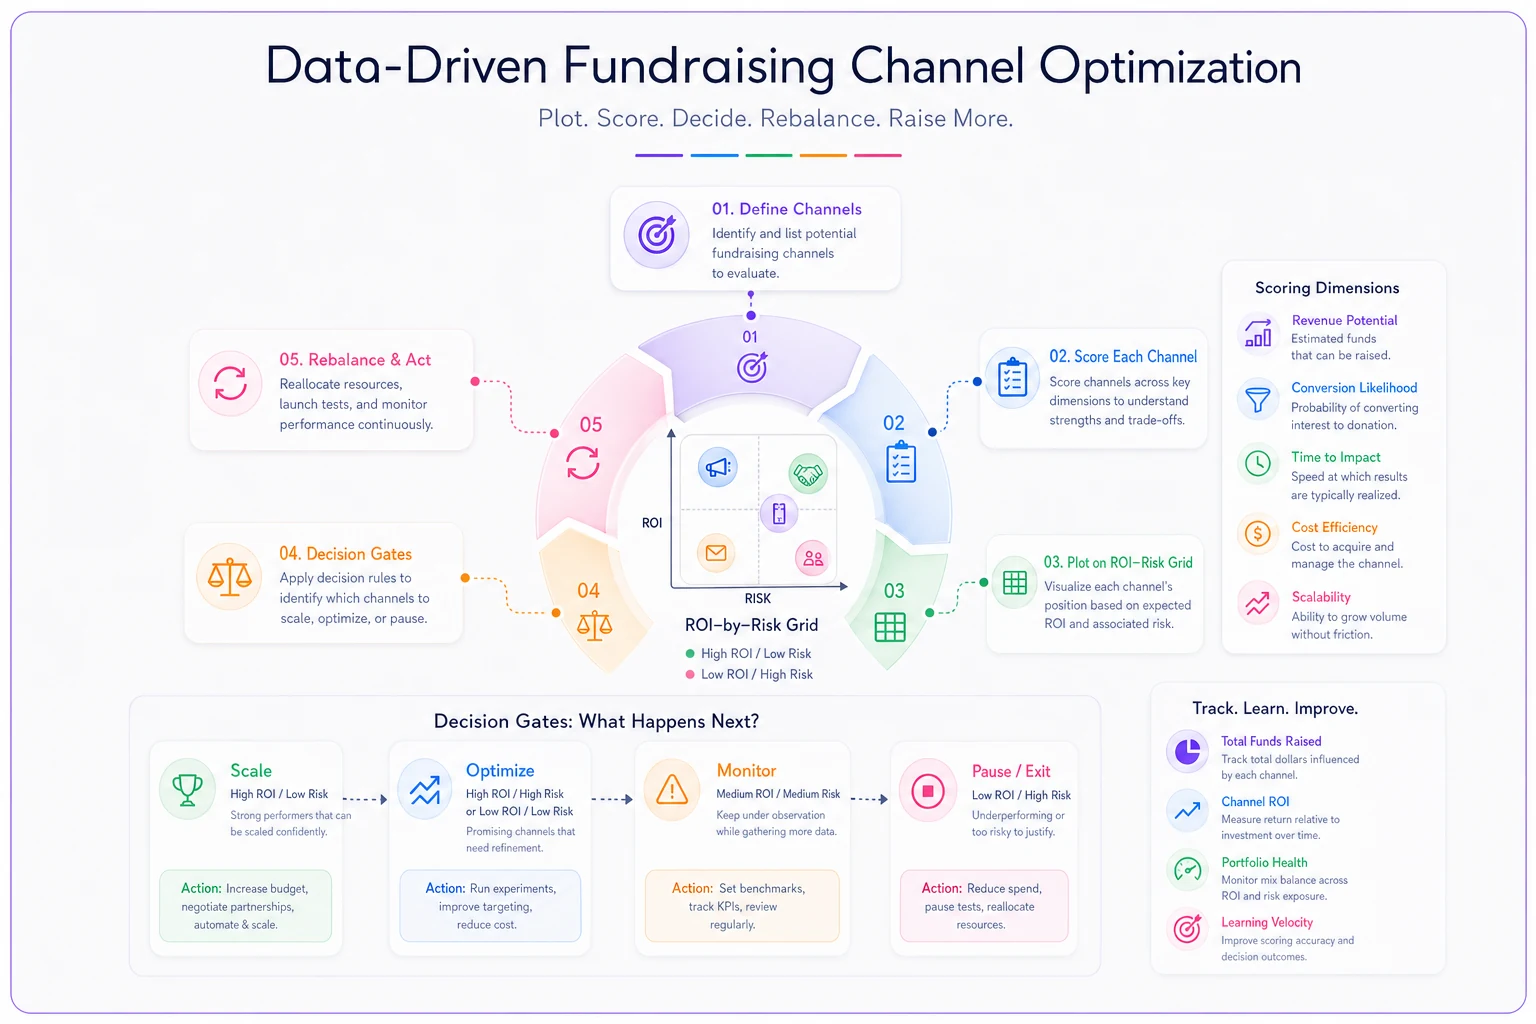
Here's a simple visual of how the workbook plots channels and triggers rebalancing.
Sample three-year allocation scenarios
Boards make better decisions when they're reacting to concrete scenarios instead of generating one from scratch. Build two or three allocation scenarios across a three-year horizon and let leadership stress-test them. The point isn't to pick the "right" one — it's to surface the tradeoffs and assumptions baked into each.
Here's how three scenarios might look for an organization with a roughly $2.5M annual fundraising budget:
Scenario A — Stability. Hold the current mix, trim the two lowest-scoring channels by about 15%, and redirect that into monthly giving acquisition. Modest growth, low disruption. Best if the organization just went through leadership change or a reserve scare and needs a calm year.
Scenario B — Diversification. Deliberately reduce dependence on the top concentration risk. If events currently drive 35% of revenue, plan to bring that to 25% over three years while building major gifts and recurring giving. Slower top-line growth in year one, meaningfully lower volatility by year three.
Scenario C — Growth. Front-load investment into acquisition channels, accept a lower net yield in year one as you spend to acquire, and bank on compounding retention in years two and three. Only viable with reserve cushion and a board that won't panic when year-one ROI looks ugly.
For each scenario, the workbook should project not just revenue but the shape of risk over time. A growth scenario that hits its revenue target by leaning even harder on one volatile channel isn't actually a better position — it's a bigger bet. Make that explicit in the projection.
The common failure here is treating the three-year plan as a prediction. It's not a prediction; it's a set of commitments with built-in checkpoints. Which brings us to the part most frameworks skip.
Decision gates: when to rebalance mid-course
A plan without triggers is just a hope. Multi-year allocation plans fail not because the numbers were wrong at the start — it's that the organization kept executing the original plan nine months after the assumptions stopped being true.
Decision gates are pre-agreed thresholds that force a rebalancing conversation. Setting them in advance means you decide the rule while you're calm, not while you're watching a channel crater and arguing emotionally about whether to intervene.
-
Performance gate. If any channel comes in more than 20% below its net-yield projection at the mid-year mark, it triggers a formal review — continue, fix, or defund. No automatic renewal into year two.
-
Concentration gate. If any single donor, sponsor, or grant grows to more than 25% of unrestricted revenue, that triggers a diversification mandate regardless of how well things are going. Success can be its own risk.
-
Capacity gate. If a channel's staff hours exceed its budgeted allocation by a set margin two quarters running, it gets reviewed for either more resources or sunset. Programs that quietly eat labor they were never budgeted for are a top hidden cost.
-
Opportunity gate. A pre-defined reserve — say, 5% of the fundraising budget — held back specifically to fund mid-year opportunities that beat the lowest-scoring active channel on the matrix. This keeps you from being locked into a stale allocation when something genuinely better appears in month seven.
Gate design is where boards and executives split responsibility cleanly. The board sets the thresholds and reviews when gates trip. Staff monitor the numbers and bring the trigger to the table. That separation stops the board from micromanaging monthly results while keeping them genuinely accountable for the big reallocations.
When this framework makes sense — and when it doesn't
This level of structure isn't free. Building and maintaining it costs real staff time, and for some organizations that cost outweighs the benefit.
When it genuinely makes sense:
-
You're running four or more meaningful revenue channels and they're competing for the same budget and the same donors.
-
Your board has grown large or divided enough that allocation decisions turn into lobbying contests.
-
You've had at least one "how did we not see that coming" revenue shock — a lost grant, a departed major donor, an event that lost money.
-
You're planning a capacity campaign or growth push and need defensible allocation logic to back it.
When it's overkill:
-
A sub-$500k organization running two channels and an executive director who knows every major donor by name. Formalizing this would add process without improving decisions.
-
Organizations mid-crisis. If you're three months from insolvency, you don't need a three-year scenario workbook — you need a cash plan. Build the framework after you stabilize.
Who should NOT start here: teams that don't yet have trustworthy cost and revenue data. A scoring matrix built on bad numbers produces confident, precise, wrong answers — which is worse than admitting you're guessing. Get your attribution and cost allocation defensible first. A Pragmatic Framework for Nonprofit Fundraising Metrics and Attribution is the groundwork that makes everything above trustworthy; skip it and the portfolio exercise becomes theater.
A governance checklist for investment requests
Once the framework exists, the discipline lives or dies on how new spending requests get handled. The goal is that nobody — not a passionate program director, not a board member with a pet idea — can inject new spending into the portfolio without running the same gauntlet every existing channel runs. Use this checklist for any request above a set dollar threshold:
-
Does the request include a full cost estimate? Staff hours and shared overhead included, not just direct expenses.
-
Which quadrant does it land in? Projected ROI and honest risk score, plotted against existing channels.
-
What does it displace? New spending comes from somewhere. Name the channel or reserve it draws from.
-
What's the decision gate? Define upfront what underperformance looks like and when the request gets reviewed or killed.
-
Who owns it? A single accountable person, not a committee, with the capacity to actually run it.
-
Is there a concentration implication? Does this deepen an existing dependency or diversify away from one?
-
What's the exit plan? How you'd wind it down cleanly if it fails the first performance gate.
The single most useful item on that list is "what does it displace." Most dysfunctional portfolios grew by addition — every new idea got funded without anything getting cut, until the team was spread across eleven channels and excellent at none. Forcing every new request to name its tradeoff is what keeps a portfolio a portfolio rather than a junk drawer.
Keeping the system alive
A framework is only as good as the data feeding it, and this is where good intentions usually die. The scoring matrix requires current net-yield figures. The risk workbook requires concentration data pulled from your donor records. The decision gates require someone actually watching channel performance against projections every quarter, without being nagged.
Pulling those numbers manually — exporting from the CRM, reconciling against finance, rebuilding the quadrant chart by hand — is enough friction that most organizations do it once, present it proudly to the board, and then never update it. Six months later the "framework" is a stale slide deck.
Automate feeding donor concentration and channel cost data from your CRM into the workbook so decision gates can trigger without manual effort.
This is the practical case for running the underlying tracking inside an operational platform rather than a graveyard of spreadsheets. When channel costs, donor concentration, and performance-against-plan update automatically, the decision gates can actually trigger — the system flags that a channel crossed its threshold instead of hoping someone notices. The framework shifts from an annual ceremony to a living instrument leadership actually consults between board meetings. That's the difference between a portfolio you designed and one you actively manage.
Bringing it together
The organizations that allocate well aren't smarter about any individual channel. They're more honest about the whole picture — willing to score a beloved program against a boring-but-efficient one, willing to name concentration risk out loud, willing to set rebalancing triggers before they're needed and actually honor them when they trip.
Start smaller than you think you should. Score your existing channels on the six dimensions. Plot them on the ROI-by-risk grid. Set two or three decision gates and agree on who watches them. Run one three-year scenario and pressure-test it with your board. That's a working portfolio framework — not a perfect one, but a real one you can tighten each year.
The polish comes later. The discipline of comparing unlike programs on shared terms, and committing to pull money back when the gates trip, is what actually protects the organization.
Ready to elevate your fundraising efforts?
Join 2,000+ nonprofits using Givioly to save time, increase donations, and build lasting donor relationships.