



Most measurement advice aimed at nonprofits skips the hard part. It assumes you already have clean data, a named owner for metrics, and a board that trusts the numbers. In reality, teams that struggle with attribution and forecasting are usually stuck for a much more boring reason: nobody has a complete picture of what data exists, and nobody ever agreed on what a "donor" or a "campaign" actually means inside the database.
So this isn't a model about dashboards. It's a model about capability — what your organization can reliably answer, and what it can't yet. The useful frame is a fundraising measurement maturity model that moves in a fixed sequence: you can't do trustworthy attribution on top of ungoverned metrics, and you can't do predictive work on top of attribution nobody believes. Skipping stages is the single most common reason measurement projects fall apart six months in.
The stages, in order
The stages, in order:
-
Inventory — know what data and sources you actually have
-
Governed metrics — agree on definitions and who owns them
-
Attribution — connect outcomes to effort honestly
-
Predictive insights — forecast and prioritize
-
Embedded decision-making — measurement changes behavior, not just reports
Each stage below includes what "done" looks like, the minimum staff investment, and a sample low-cost artifact you can build this quarter.
Why teams jump straight to Stage 3 and fall apart
The pattern repeats across organizations of very different sizes. A development director gets asked by the board, "Which channel brings in our best donors?" — and tries to answer it directly. They export data from the CRM, the email tool, and the events platform, stitch it together in a spreadsheet, and produce a confident-looking chart.
Simplify donor management and fundraising workflows.
Givioly helps you organize campaigns, engage donors, and maximize fundraising impact seamlessly.
- Unified donor profiles
- Real-time donation tracking
- Automated impact reporting
No credit card required
Then someone notices the email list counts a gift twice because it fired both an acknowledgment and a receipt. Someone else points out that "event revenue" includes a $25,000 sponsorship that was really a corporate grant. The number is wrong, the board loses trust, and the next three measurement requests get quietly shelved.
What happened is a stage violation. The team tried to do attribution (Stage 3) without inventory (Stage 1) or governed definitions (Stage 2). The chart wasn't wrong because the analyst was bad — it was wrong because the foundation didn't exist yet.
That's what this model is designed to prevent. When you know which stage you're actually at, you stop promising answers the data can't support, and you start building the thin layer underneath that makes the next answer possible.
Stage 1 — Inventory
The question this stage answers: What data do we have, where does it live, and can we trust where it came from?
Inventory is unglamorous and it's where almost every real improvement starts. Before you measure anything, you need a map: every system that holds donor or revenue data, who owns it, how records get in, and where the duplicates and gaps live.
Small teams discover surprising things here. A single mid-sized nonprofit might have giving data spread across a CRM, a peer-to-peer platform, a payment processor, two event tools, a spreadsheet the events coordinator maintains personally, and the finance system — none of which agree on totals for the same quarter. The gap between CRM-reported revenue and finance-reported revenue is often somewhere in the 3–8% range, and nobody can explain it because nobody has ever reconciled the two side by side.
What "done" looks like for Stage 1:
-
A written list of every system holding donor, gift, or campaign data
-
A named owner for each system
-
A documented "source of truth" for revenue (usually finance) and for donor records (usually the CRM)
-
A known, written explanation for the biggest reconciliation gaps
Minimum-staff investment: One person, roughly 6–10 hours over two weeks, interviewing whoever touches each system. No new hires. No new tools.
Sample low-cost artifact — the Data Source Register:
| System | Owner | Data it holds | How records enter | Known issues |
|---|---|---|---|---|
| CRM | Dev Director | Donors, gifts, soft credits | Manual + batch import | Duplicate households |
| Payment processor | Finance | Transactions, fees | Automatic | No campaign tag |
| Events tool | Events Coord | RSVPs, ticket revenue | Manual export | Not synced to CRM |
| P2P platform | Comms | Participant gifts | API sync (partial) | Soft credits miss |
This single table does more for measurement maturity than any dashboard, because it tells you honestly what you can and can't claim. If you want to go deeper on cataloging and sync patterns across tools, the integrated fundraising tech roadmap covers vendor-neutral integration and reconciliation runbooks that pair naturally with this register.
Start with reconciling CRM and finance — it's the classic gap that unlocks trust.
When to move on: You can answer "where did this number come from?" for any revenue figure within five minutes.
Stage 2 — Governed Metrics
The question this stage answers: Do we all mean the same thing when we say "donor," "retention," or "campaign revenue"?
This is the stage most teams underrate, and it's the one that quietly causes the most damage. Two people in the same organization can report "donor retention" and get different numbers — not because either is wrong, but because one counts by donor record and the other counts by household, one includes recurring gifts and the other doesn't, and neither wrote the definition down anywhere.
Governance here isn't bureaucracy. It's a short, boring document that says: this is how we calculate each metric, this is who owns the definition, and this is how a definition gets changed. Once that exists, two different reports stop contradicting each other, and the board stops asking why last month's retention number doesn't match this month's.
-
Retention = donors who gave in the prior 12-month period AND the current 12-month period, counted at the household level
-
New donor = first gift ever recorded, not first gift this fiscal year
-
Campaign revenue = gifts tagged to the campaign at the time of the gift, excluding pledges not yet fulfilled
-
Average gift = median, not mean, reported alongside the count (because one major gift distorts the mean badly)
Minimum-staff investment: A two-hour working session with everyone who produces numbers, plus one person to write and maintain the definitions. The ongoing cost is near zero once the first version exists.
Sample low-cost artifact — the Metric Definition Sheet. One row per metric: name, plain-English meaning, exact calculation logic, owner, last reviewed date. Ten to fifteen metrics is plenty for most organizations.
The deeper governance scaffolding — ownership, RACI, and audit cadence — is worth formalizing once definitions stabilize. The practical data governance policy for small nonprofits lays out the policy, roles, and audit playbook that keep these definitions from drifting over time.
The mistake people make here: treating governance as a one-time event. Definitions rot. A new platform gets added, someone changes a tag, and six months later the "governed" metric silently means something different. The review date on the definition sheet is what keeps it alive.
When to move on: Two people can independently produce the same retention number without talking to each other first.
Stage 3 — Attribution
The question this stage answers: Which efforts actually drive which outcomes — and can we defend the answer?
Only now does attribution become honest. With a clean inventory and governed definitions underneath it, you can start connecting gifts to the channels, appeals, and touchpoints that produced them without the numbers collapsing under scrutiny.
The important shift at this stage is accepting that attribution is a model, not a fact. A year-end gift might follow an email, a direct mail piece, a personal call from the ED, and an event the donor attended in March. Assigning 100% of that gift to "email" because email came last is a choice, and it's usually the wrong one. Mature teams pick an attribution approach on purpose — last-touch, first-touch, or a simple weighted split — and document why, so the model stays consistent across campaigns.
A typical example: a small shop runs a spring appeal and reports $90k in revenue. Last-touch attribution credits email with 70% of it. But when they layer in multi-touch and look at which donors had prior personal contact, they find the email mostly closed gifts that major-gift cultivation had already warmed up. The email didn't create $63k of value — it harvested relationships built elsewhere. That insight changes budget allocation, and it's only possible because the definitions and sources were solid first.
Minimum-staff investment: This is the first stage where you might feel the pull toward a dedicated tool. You don't need one yet. A consistent tagging convention, applied discipline at gift entry, and a monthly reconciliation routine get most small teams a trustworthy attribution picture. One analyst spending 4–6 hours a month maintaining it is realistic.
A simple diagram of the attribution workflow can make the model and its reconciliation steps clear to non-technical stakeholders.
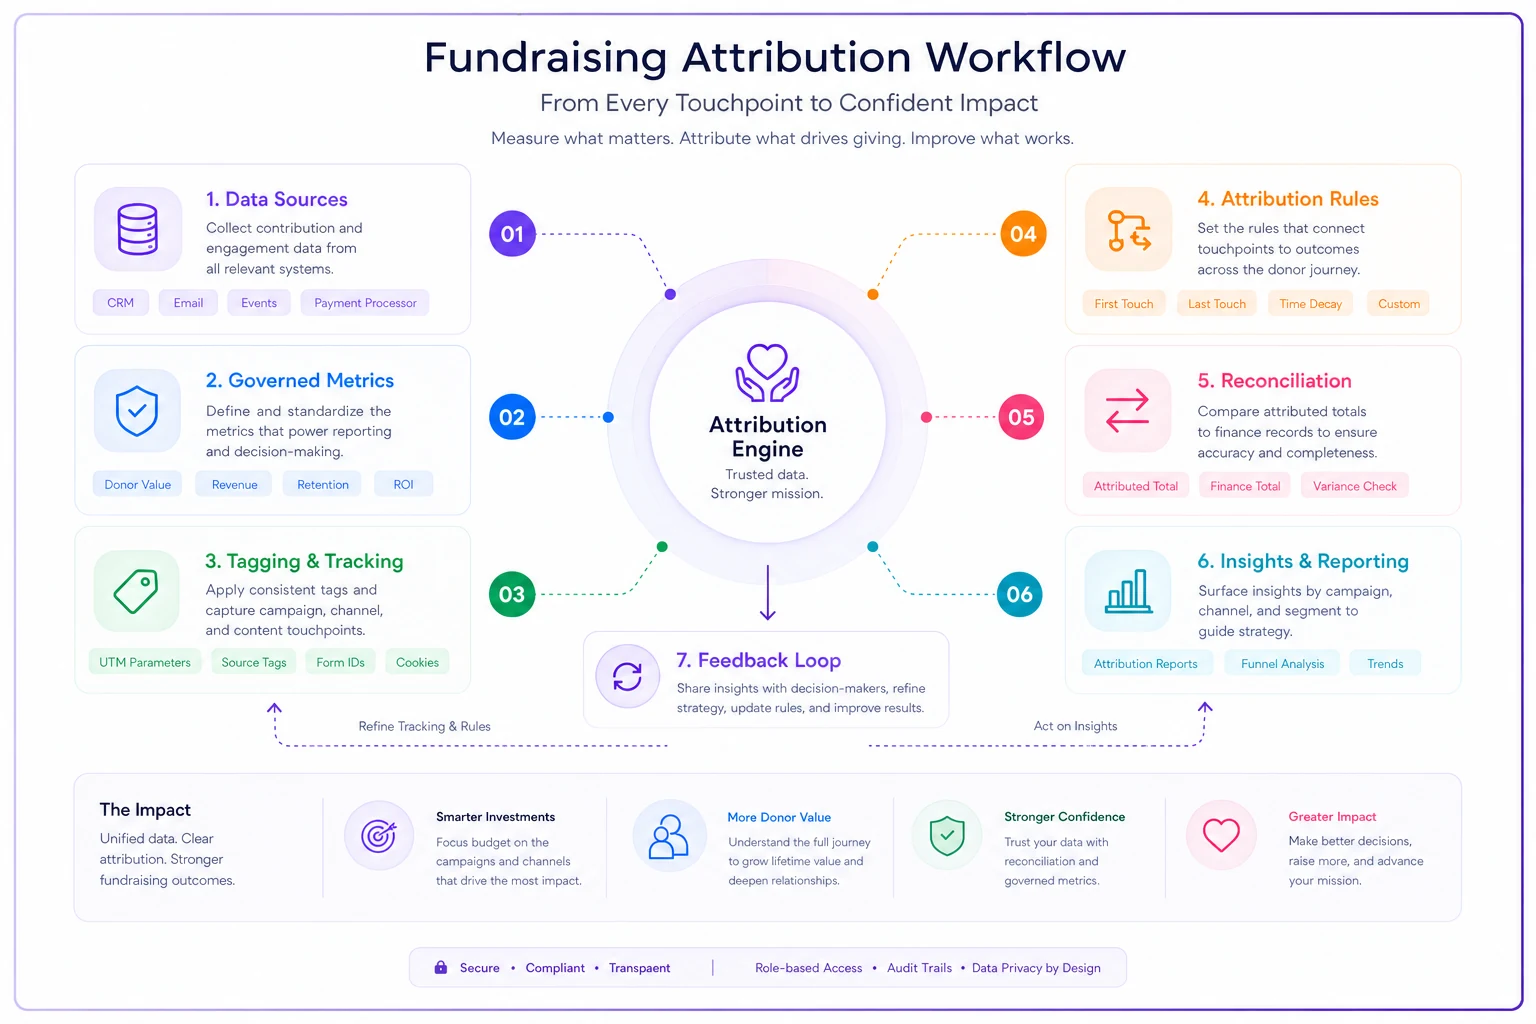
Sample low-cost artifact — the Attribution Rules Doc:
-
Stated attribution model (e.g., last-touch for digital, override for known major-gift relationships)
-
The exact set of valid campaign/channel tags
-
Rules for handling multi-channel gifts
-
A monthly check comparing attributed revenue to governed total revenue (they must reconcile)
For the full logic of connecting metrics to attribution without overengineering it, the pragmatic framework for nonprofit fundraising metrics and attribution walks through how to keep the model simple enough that a two-person team can actually maintain it.
When this is a bad idea: Don't attempt attribution if Stage 2 isn't solid. Attribution built on ungoverned metrics produces confident, precise, wrong answers — which are worse than admitting you don't know yet.
When to move on: You can explain, with a straight face, why a given gift is credited to a given channel — and the attributed totals reconcile to finance.
Stage 4 — Predictive Insights
The question this stage answers: What's likely to happen next, and where should we focus effort before the outcome is locked in?
Prediction is where small teams either create real leverage or waste money on tools they can't feed. The uncomfortable truth is that predictive work is only as good as Stages 1–3 underneath it. A churn model trained on inconsistent retention definitions and messy attribution will confidently flag the wrong donors.
Done right, predictive insight at this stage is often simpler than people expect. You don't need machine learning to get value. A well-built scoring sheet — recency, frequency, upgrade history, channel responsiveness — often outperforms a black-box model nobody trusts. The point of this stage isn't sophistication; it's acting before the outcome happens instead of reporting on it afterward.
-
A monthly list of recurring donors showing early lapse signals (missed payment, reduced engagement) so stewardship can intervene
-
A simple forecast range for year-end revenue based on prior-year pacing, updated weekly during campaign season
-
A prioritized list of mid-level donors with upgrade probability based on governed, attributed history
Where automation genuinely earns its place: this is the first stage where AI-assisted operational tooling starts paying off cleanly — because by now your data is clean enough to trust it. Teams that reach Stage 4 often use automation to score donors continuously, flag lapse risk the moment it appears, and keep forecasts updating without someone re-running spreadsheets every week. The reason it works here and not earlier is that the maturity model did its job: automation applied to messy Stage 1 data just produces faster bad answers. Applied to governed, attributed data, it removes the manual lift of scoring and monitoring so a small team can watch more donors than they ever could by hand.
Minimum-staff investment: Varies. A scoring sheet maintained monthly costs almost nothing in people. Continuous scoring and automated lapse alerts are where a modest platform investment starts returning more time than it costs — but only at this stage.
Who should not do this: Any organization that can't yet reconcile CRM revenue to finance revenue. If Stage 1 is shaky, predictive tooling will produce output that looks authoritative and misleads your board. Fix the foundation first.
Stage 5 — Embedded Decision-Making
The question this stage answers: Does measurement actually change what we do — or do we just produce reports nobody acts on?
The final stage isn't technical at all. It's cultural and operational. Plenty of organizations reach Stage 4, build good forecasts and scores, and then keep doing exactly what they were doing before. The lapse alerts go unactioned. The upgrade list sits in a tab nobody opens.
Stage 5 is reached when measurement is wired into routine decisions: the weekly stewardship meeting works off the lapse-risk list, budget reallocation follows attribution findings, and the board's quarterly review changes at least one decision based on the forecast. Measurement stops being a reporting function and becomes an operating input.
The tell that you've reached it: someone outside the data team asks for a number before making a decision, not after, to justify one already made.
Minimum-staff investment: Zero new tools. The investment is meeting discipline and leadership insistence that decisions reference the numbers. This stage is free and it's the hardest to reach.
A one-page executive roadmap
If you need to show leadership where you are and what's next, this is the whole model on a page:
| Stage | You can reliably... | Biggest risk if skipped | Core artifact | Staff cost |
|---|---|---|---|---|
| 1 — Inventory | Trace any number to a source | Everything downstream is unverifiable | Data Source Register | ~6–10 hrs, 1 person |
| 2 — Governed Metrics | Produce the same number twice | Reports contradict each other | Metric Definition Sheet | 2-hr session + upkeep |
| 3 — Attribution | Credit outcomes defensibly | Confident wrong answers | Attribution Rules Doc | 4–6 hrs/month |
| 4 — Predictive | Act before outcomes lock in | Fast wrong predictions | Scoring sheet / forecast | Low to moderate |
| 5 — Embedded | Change decisions with data | Reports nobody acts on | Decision-linked meetings | Discipline only |
If you need to show leadership where you are and what's next, this is the whole model on a page:
The upgrade sequence: how to actually climb one level
Here's the order of operations that keeps teams from overreaching:
-
Score yourself honestly. Pick the highest stage where "done" is fully true. If you can't reconcile revenue, you're at Stage 1 no matter how nice your dashboard looks.
-
Build the artifact for your current stage before touching the next. The register, the definition sheet, the rules doc — these are the load-bearing pieces.
-
Reconcile across one gap you've been ignoring. CRM vs. finance is the classic one. Document the explanation.
-
Write the definitions down and assign owners. Governance doesn't exist until it's on paper with a name next to it.
-
Only then layer attribution, and only after that, prediction.
-
Review quarterly. Maturity regresses. A new platform or a staff change can quietly knock you down a stage.
A short real scenario
A short real scenario
A regional environmental nonprofit — three-person development team, roughly $1.2M annual revenue — came in convinced they needed a predictive analytics platform. Their board kept asking which channels performed best and they couldn't answer.
The honest assessment put them at Stage 1. Their CRM showed around $1.26M in gifts; finance showed closer to $1.19M, and nobody had reconciled the gap, which turned out to be a mix of double-counted event gifts and uncredited stock donations. They had no written metric definitions, so "retention" meant different things in the ED's report and the grant report.
They spent one quarter doing unglamorous work: built the source register, closed the reconciliation gap, wrote fifteen metric definitions. No new hires, no predictive tool. By the next board meeting they could answer the channel question with numbers that reconciled — and the forecast they eventually built at Stage 4 was trusted precisely because the foundation was visible. The predictive platform they thought they needed on day one would have produced garbage on top of messy data; by the time they adopted light automation for donor scoring, the data under it was clean enough to make it worth having.
Where most teams should focus first
If you take one thing from this: the fastest measurement improvement available to almost any nonprofit is not a better dashboard or a smarter model. It's finishing Stage 1 and Stage 2 — the inventory and the definitions — because every later capability depends on them and almost nobody does them completely.
The maturity model isn't a ladder you have to climb to the top of. Plenty of healthy organizations operate well at Stage 3, answering attribution questions honestly and never needing continuous prediction. The goal isn't to reach Stage 5. It's to know exactly which stage you're really at, build the one artifact that stage requires, and stop promising answers your data can't yet support. That honesty — more than any tool — is what earns back a board's trust in the numbers.
If you take one thing from this: the fastest measurement improvement available to almost any nonprofit is not a better dashboard or a smarter model. It's finishing Stage 1 and Stage 2 — the inventory and the definitions — because every later capability depends on them and almost nobody does them completely.
The maturity model isn't a ladder you have to climb to the top of. Plenty of healthy organizations operate well at Stage 3, answering attribution questions honestly and never needing continuous prediction. The goal isn't to reach Stage 5. It's to know exactly which stage you're really at, build the one artifact that stage requires, and stop promising answers your data can't yet support. That honesty — more than any tool — is what earns back a board's trust in the numbers.
Ready to elevate your fundraising efforts?
Join 2,000+ nonprofits using Givioly to save time, increase donations, and build lasting donor relationships.